Time-Resolved X-ray Absorption Spectroscopy

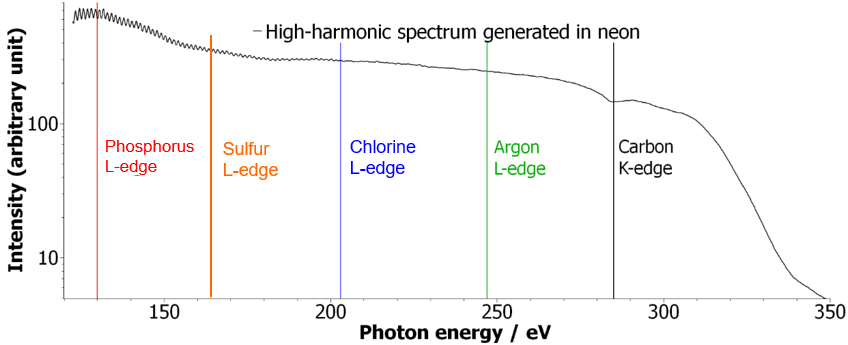
Time-resolved soft-X-ray absorption spectroscopy with a table-top source has been a long-standing goal for the several decades. Soft-x-ray sources based on high harmonic generation with long driving wavelengths have indeed been shown to generate photons with energies beyond 1 keV. However, time-resolved measurements with such sources have so far remained out of reach. We have reported the first time-resolved X-ray measurement with a high-harmonic source (7) generating the spectrum shown in Fig. 1.

spectrum
Figure 1: High harmonic spectrum generated in the neon gas cell with a 1800 nm wavelength driving field. The spectrum spanning from 100 eV to 350 eV gives access simultaneously to several edges of chemically relevant atoms.

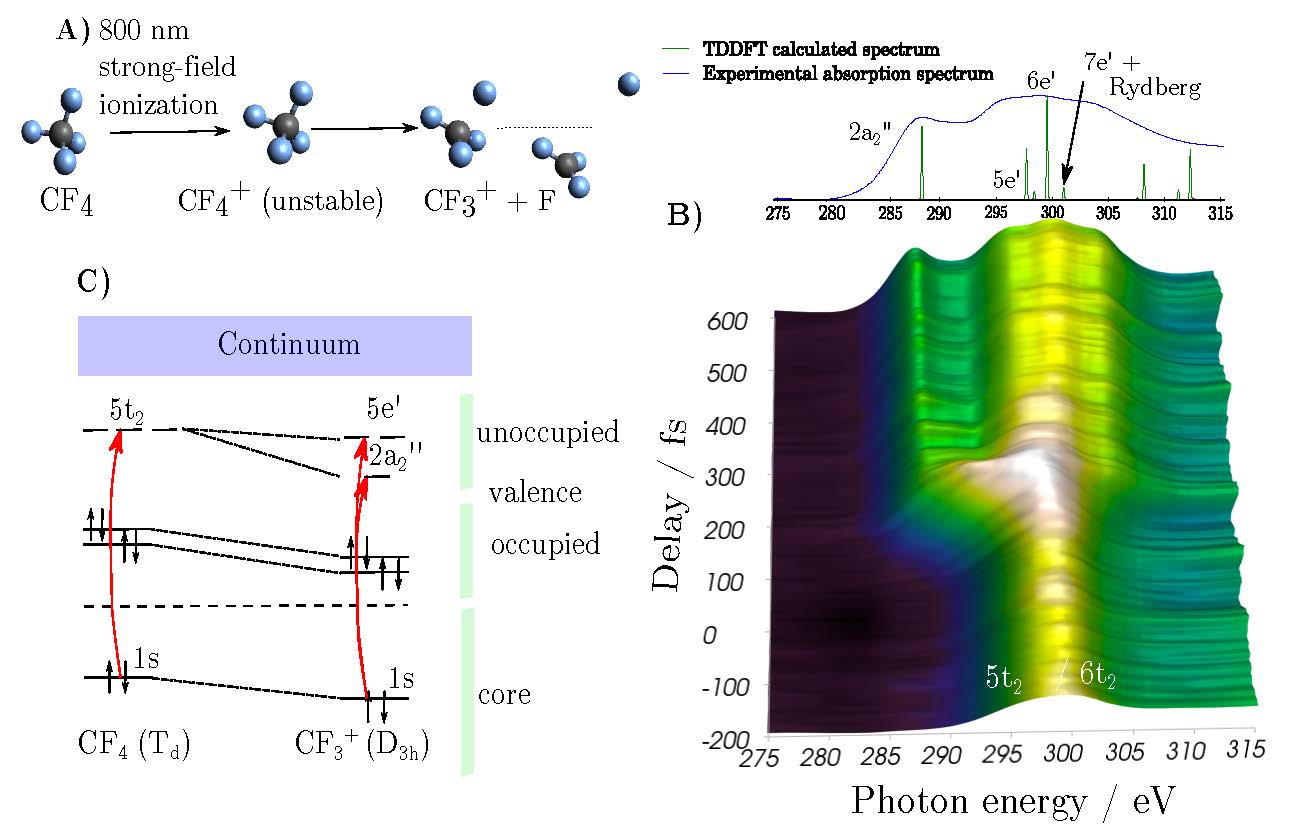
We have used this new source to observed the previously unexamined dissociative ionization reactions of CF4 and SF6 through transient-absorption spectra at the K-edge of carbon and the L-edges of sulphur.

Transient-absorption spectra are sensitive to the structural environment around the absorbing atom during the molecular dissociation. The time-resolved spectra shown in Fig. 2 reveal the change of symmetry from Td to D3h leading to line splitting and valence-Rydberg orbital mixing. The three-fold degenerate 5t2 absorption line splits into a two-fold degenerate 5e’ and a non-degenerate 2a2” absorbing line. The structural change from tetrahedral to planar geometry moreover leads to a mixing between valence and Rydberg orbitals that can be identified in the appearance of new absorption features at higher energies arising from transition to Rydberg states in CF3+.

Figure 2: Transient-absorption spectroscopy at the carbon K-edge A) An intense near-infrared pulse induces single ionization of CF4 to CF4+ which is unstable in its electronic ground state and dissociates into CF3+ + F.  B) Absorbance (A(t) = ln(I0=I(t))) as a function of the SXR-NIR time delay. C) Orbital diagram illustrating selected transitions, as obtained from TDDFT/LB94 calculations. (from Ref. (1))

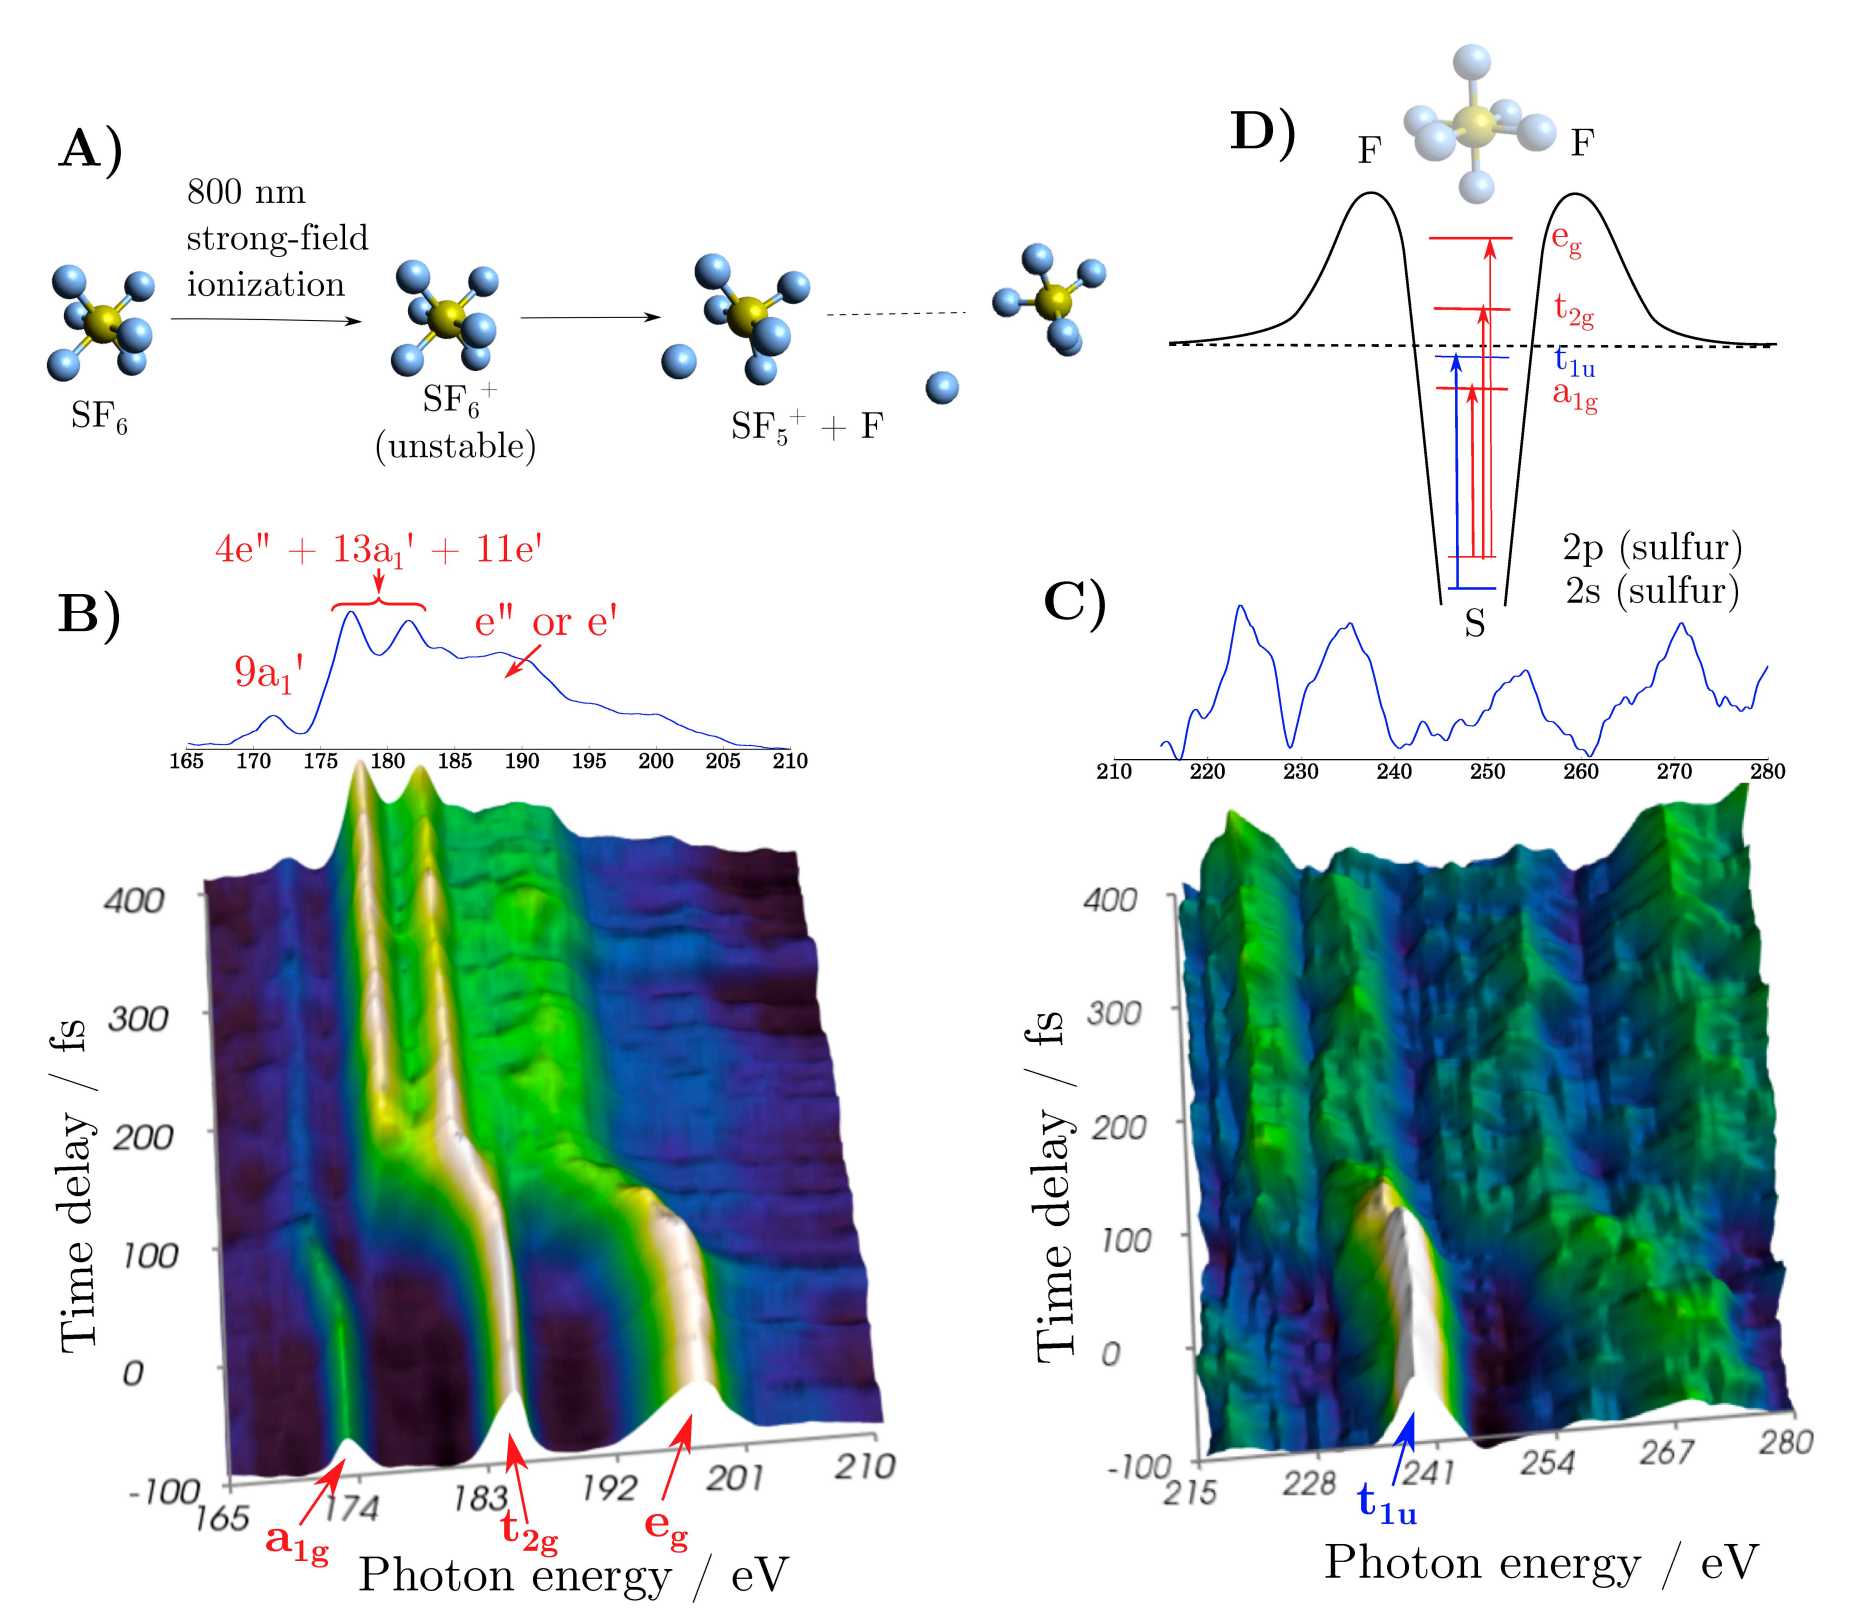
Taking advantage of the ultra-broadband spectrum of the soft x-ray probe pulse spanning from 100 eV to 350 eV (Fig. 1), the two absorption L-edges of sulfur in the SF6 molecule were accessible. This enabled us to probe in a single absorption spectrum different symmetries of the final state due to the dipole transitions selection rules. We have measured the dissociative ionization of SF6 by transient absorption at the L2,3 and the L1 absorption edges of sulfur (180.27/181.4 eV and 244.7 eV, respectively). The transient-absorption spectra recorded during the dissociation of SF6+ to SF5+ + F reveal the symmetry change from Oh to D3h. In contrast to CF4, the absorption spectrum is dominated by shape resonances in the case of SF6, which is a signature of the “cage effect” induced by the surrounding electronegative fluorine atoms. After dissociation, the absorption spectrum becomes more edge-like because of the loss of a fluoride atom opening the “cage”.

Figure 3: Transient absorption spectroscopy at the sulfur L-edges A) An intense infrared pulse induces single ionization of SF6 to SF6+ which is unstable in its electronic ground state and dissociates into SF5+ + F. B) Absorbance (A(t) = ln(I0/I(t))) at the L2,3-edge as a function of the SXR-NIR time delay. Negative time delays correspond to the SXR pulse preceding the NIR pulse. C) Absorbance at the L1-edge of SF6. The insets show absorption spectra obtained by averaging over delays of 200-400 fs. D) Orbital diagram illustrating the experimentally observed transitions. (from Ref. (1))

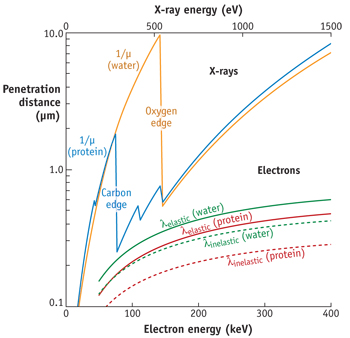
These exciting new results combining element sensitivity and femtosecond/attosecond time resolution opens new possibilities such as the study of biological molecules with localized spatial information. Moreover, the high transmission of water in the photon-energy region from 285 eV to 530 eV, called water window (Fig. 4), is now giving access to time-resolved transient absorption spectroscopy of solvated systems.

Figure 4: Penetration distance of soft x-ray photons in microns as a function of photon energy for different elements. The water-window spanning from 285 eV to 530 eV show a strong absorption from carbon and high transmission through oxygen (water). This window show the energy range where the contrast between solvent and solvated species is the best. (figure taken from 2)

1. Yoann Pertot, Cédric Schmidt, Mary Matthews, Adrien Chauvet, Martin Huppert, Vit Svoboda,  Aaron von Conta, Andres Tehlar, Denitsa Baykusheva, Jean-Pierre Wolf and Hans Jakob Wörner, Science, 05 Jan 2017, published online doi: external page10.1126/science.aah6114

2. external pagehttp://www.bioopticsworld.com/articles/print/volume-6/issue-2/features/whole-cell-tomography-molecular-biology-structural-biology--affo.html

JavaScript has been disabled in your browser